If you find any mistakes here or anywhere else on my website, email website@CoryHufford.com.
September 20, 2026
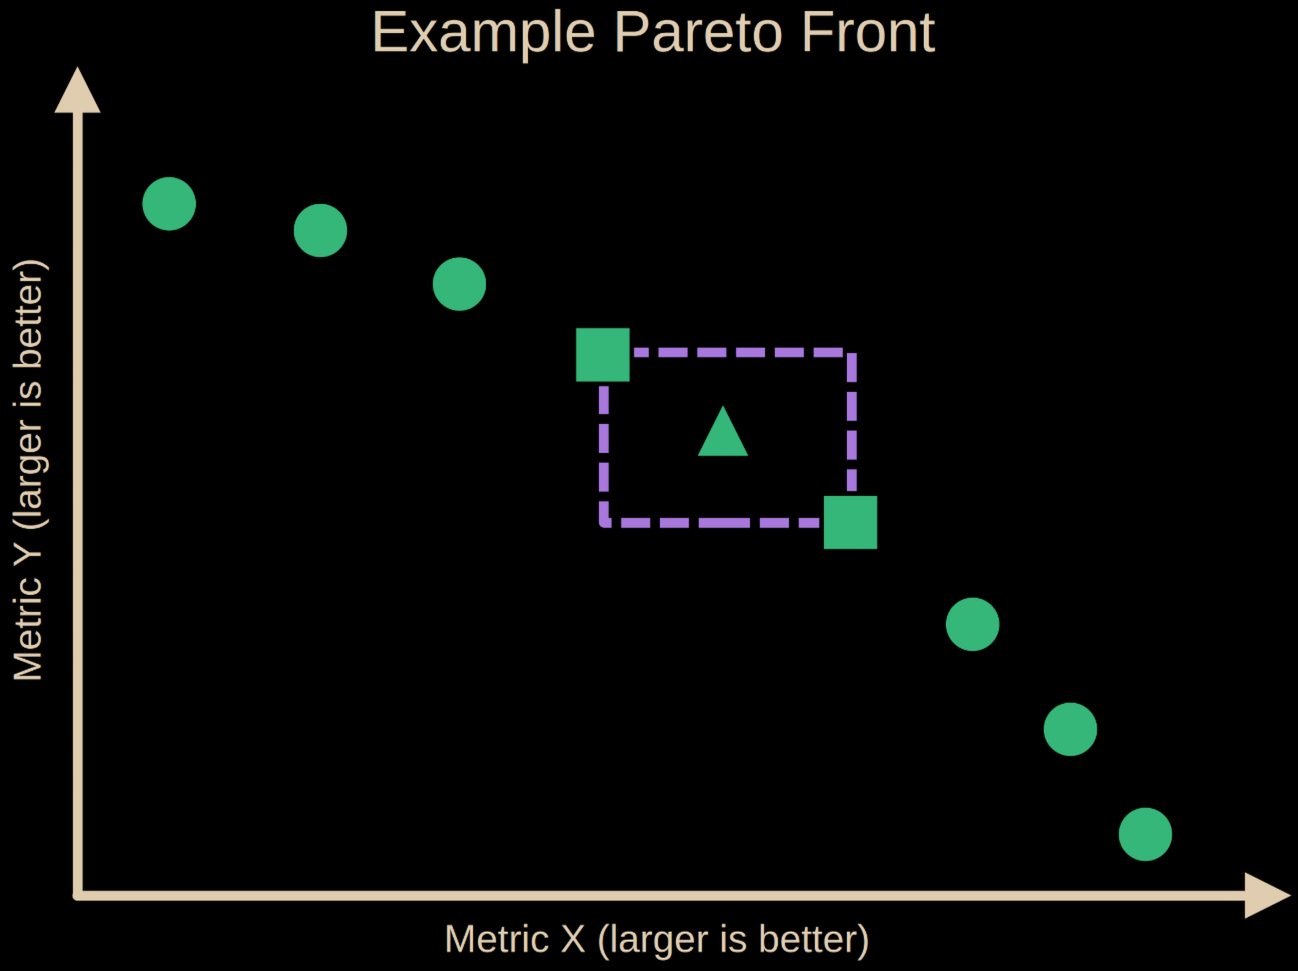
The Nondominated Sorting Genetic Algorithm II (NSGA-II) optimization algorithm sorts population members by Pareto front (sometimes called rank) and crowding distance. The crowding distance is meant to quantify how close a Pareto front member is to its neighbors across all dimensions to determine which are more valuable to the optimization. A larger crowding distance indicates a Pareto front member that's far from its neighbors and therefore should be retained. Crowding distances are calculated separately for each Pareto front. The full calculation is implemented in the code below, but in two dimensions it's equal to half the perimeter of a box formed by the neighboring Pareto front members scaled to the span of the data.
For example, the crowding distance of the triangle point below is half the perimeter of the purple dashed box formed by the neighboring Pareto front members, after the data has been scaled to the range [0, 1] on each axis. Pareto front members on the end are given a crowding distance of infinity.
The original NSGA-II algorithm ("A Fast and Elitist Multiobjective Genetic Algorithm: NSGA-II", 2002, Kalyanmoy Deb, Amrit Pratap, Sameer Agarwal, T. Meyarivan) downselects Pareto fronts by calculating the crowding distance for all the members of a Pareto front and removing the members with the smallest distances. This is called "one-shot crowding distance downselection" in the rest of this post.
What would happen if, instead of removing the desired number of Pareto front members all at once, they were removed one at a time, recalculating the crowding distances after each removal? This is called "iterative crowding distance downselection" in the rest of this post.
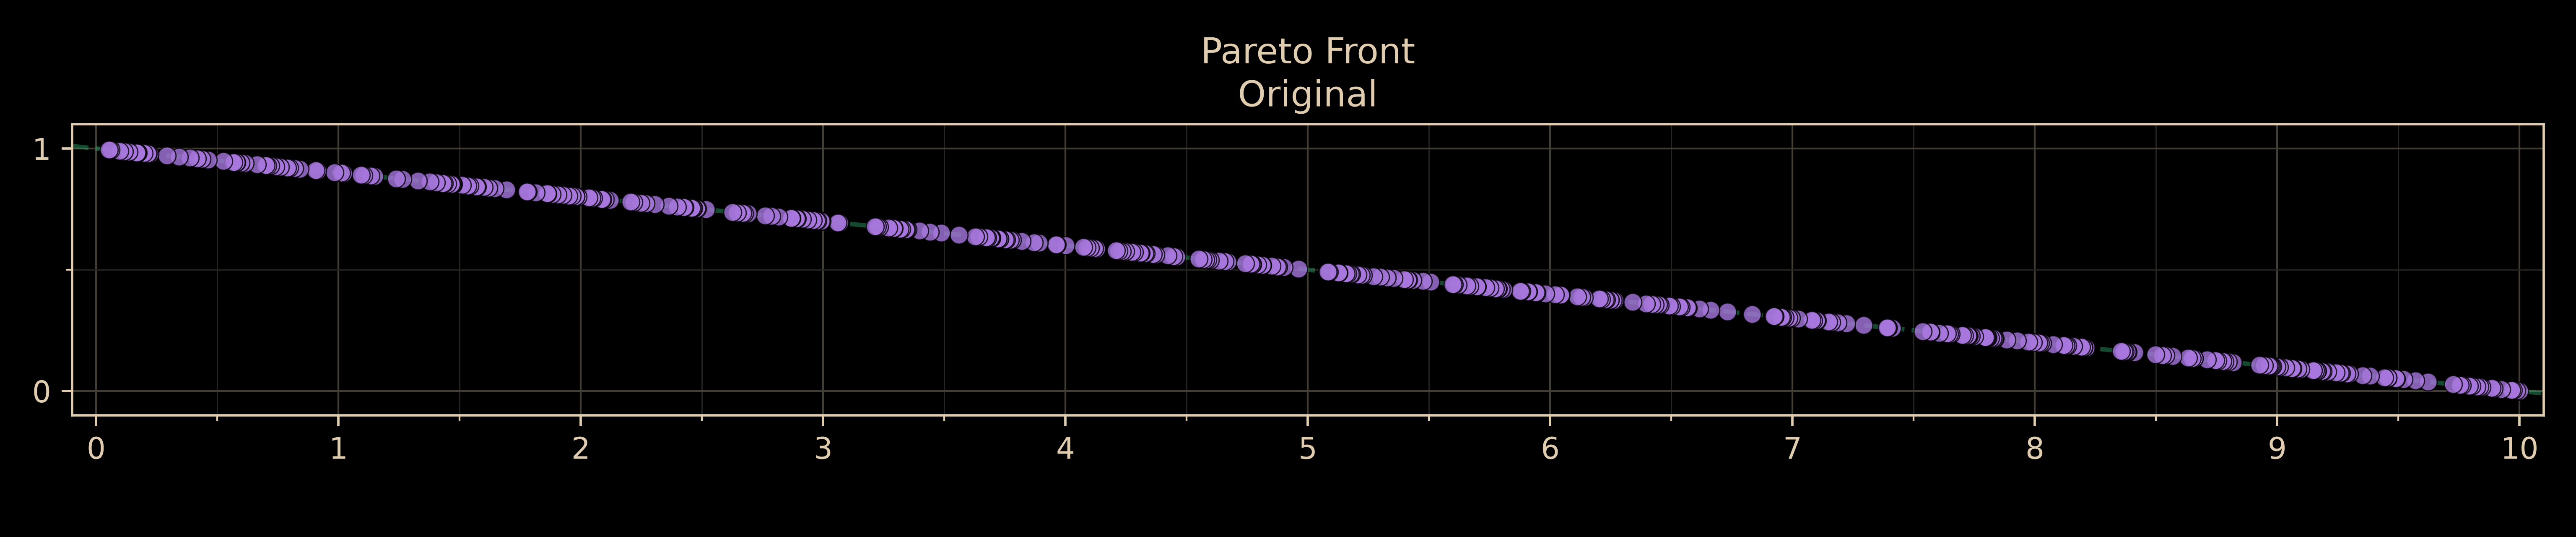
Here's a simple two-dimensional Pareto front (a straight line) of 400 random points:
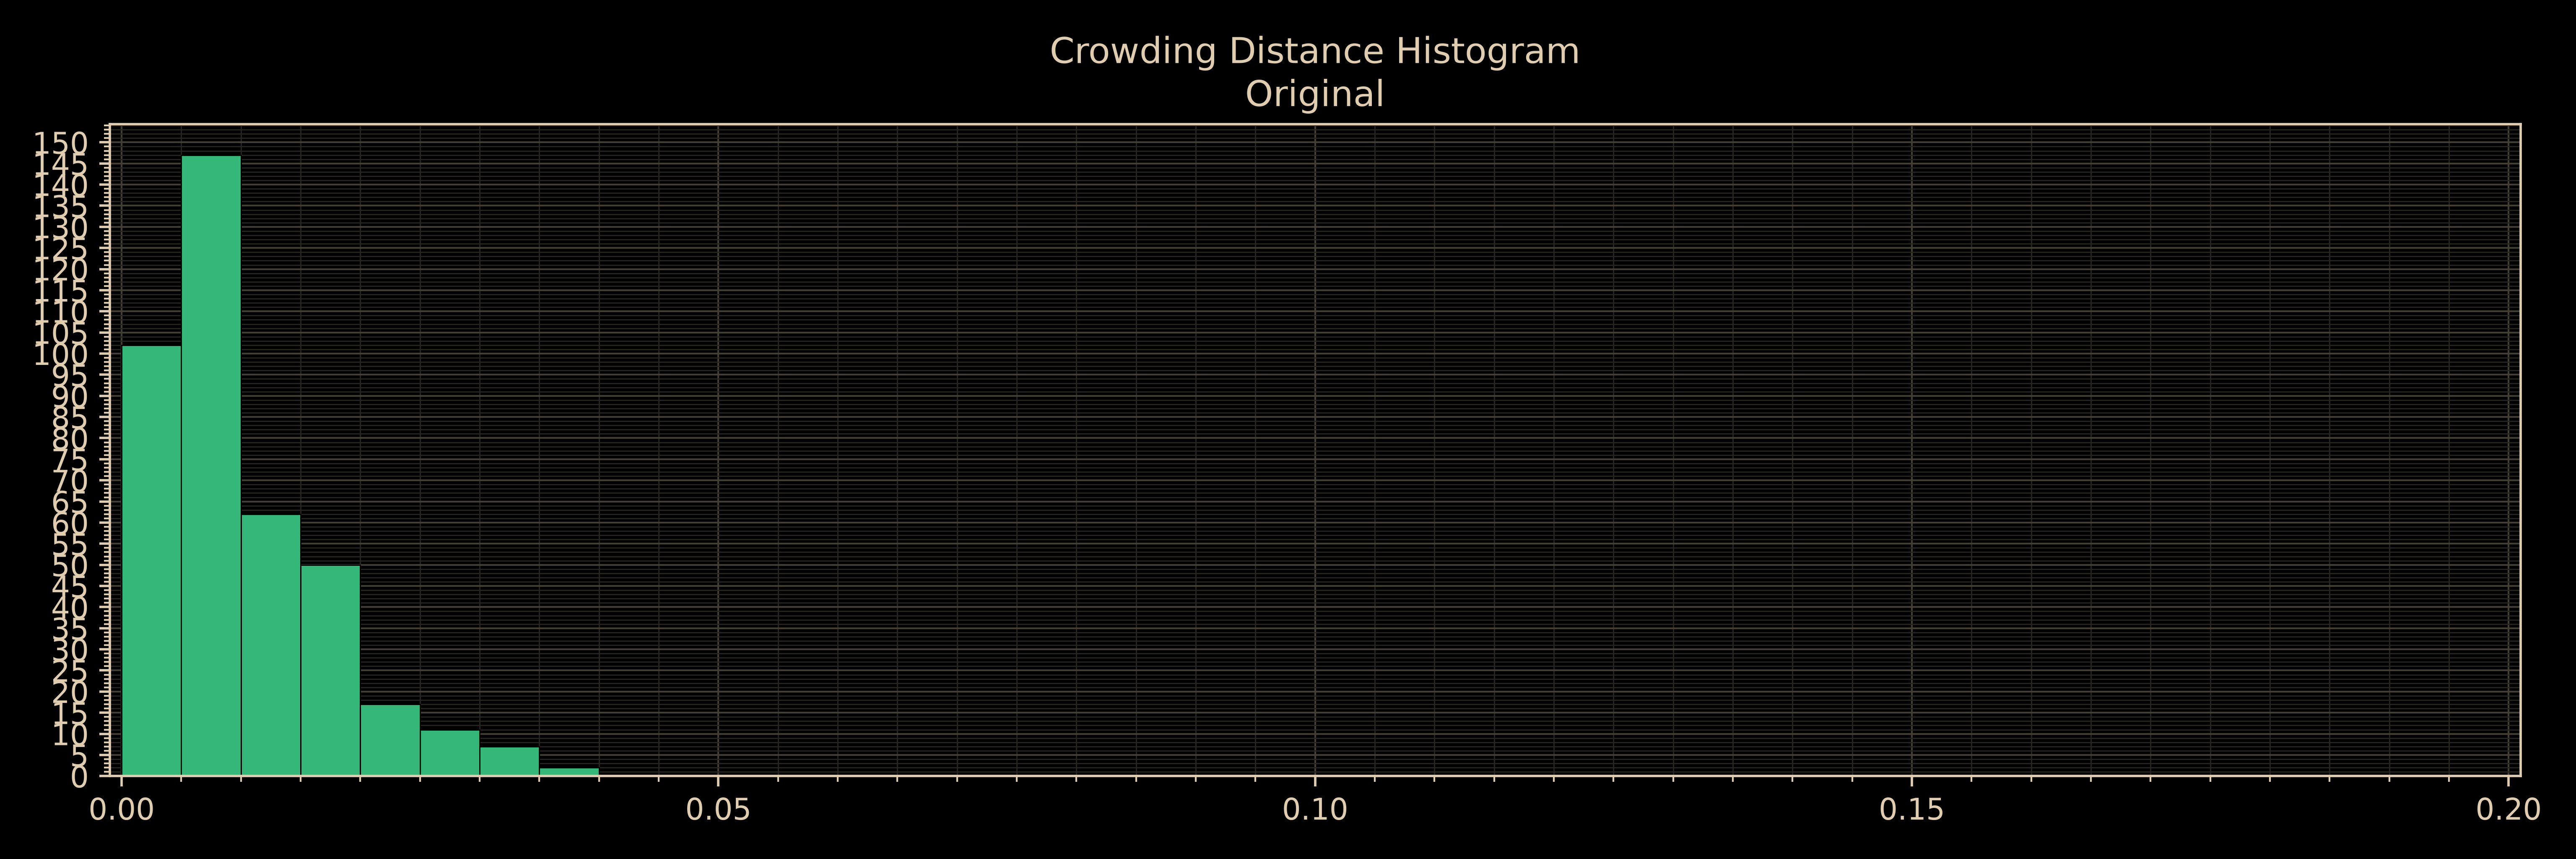
This is a histogram of the crowding distances of the random Pareto front:
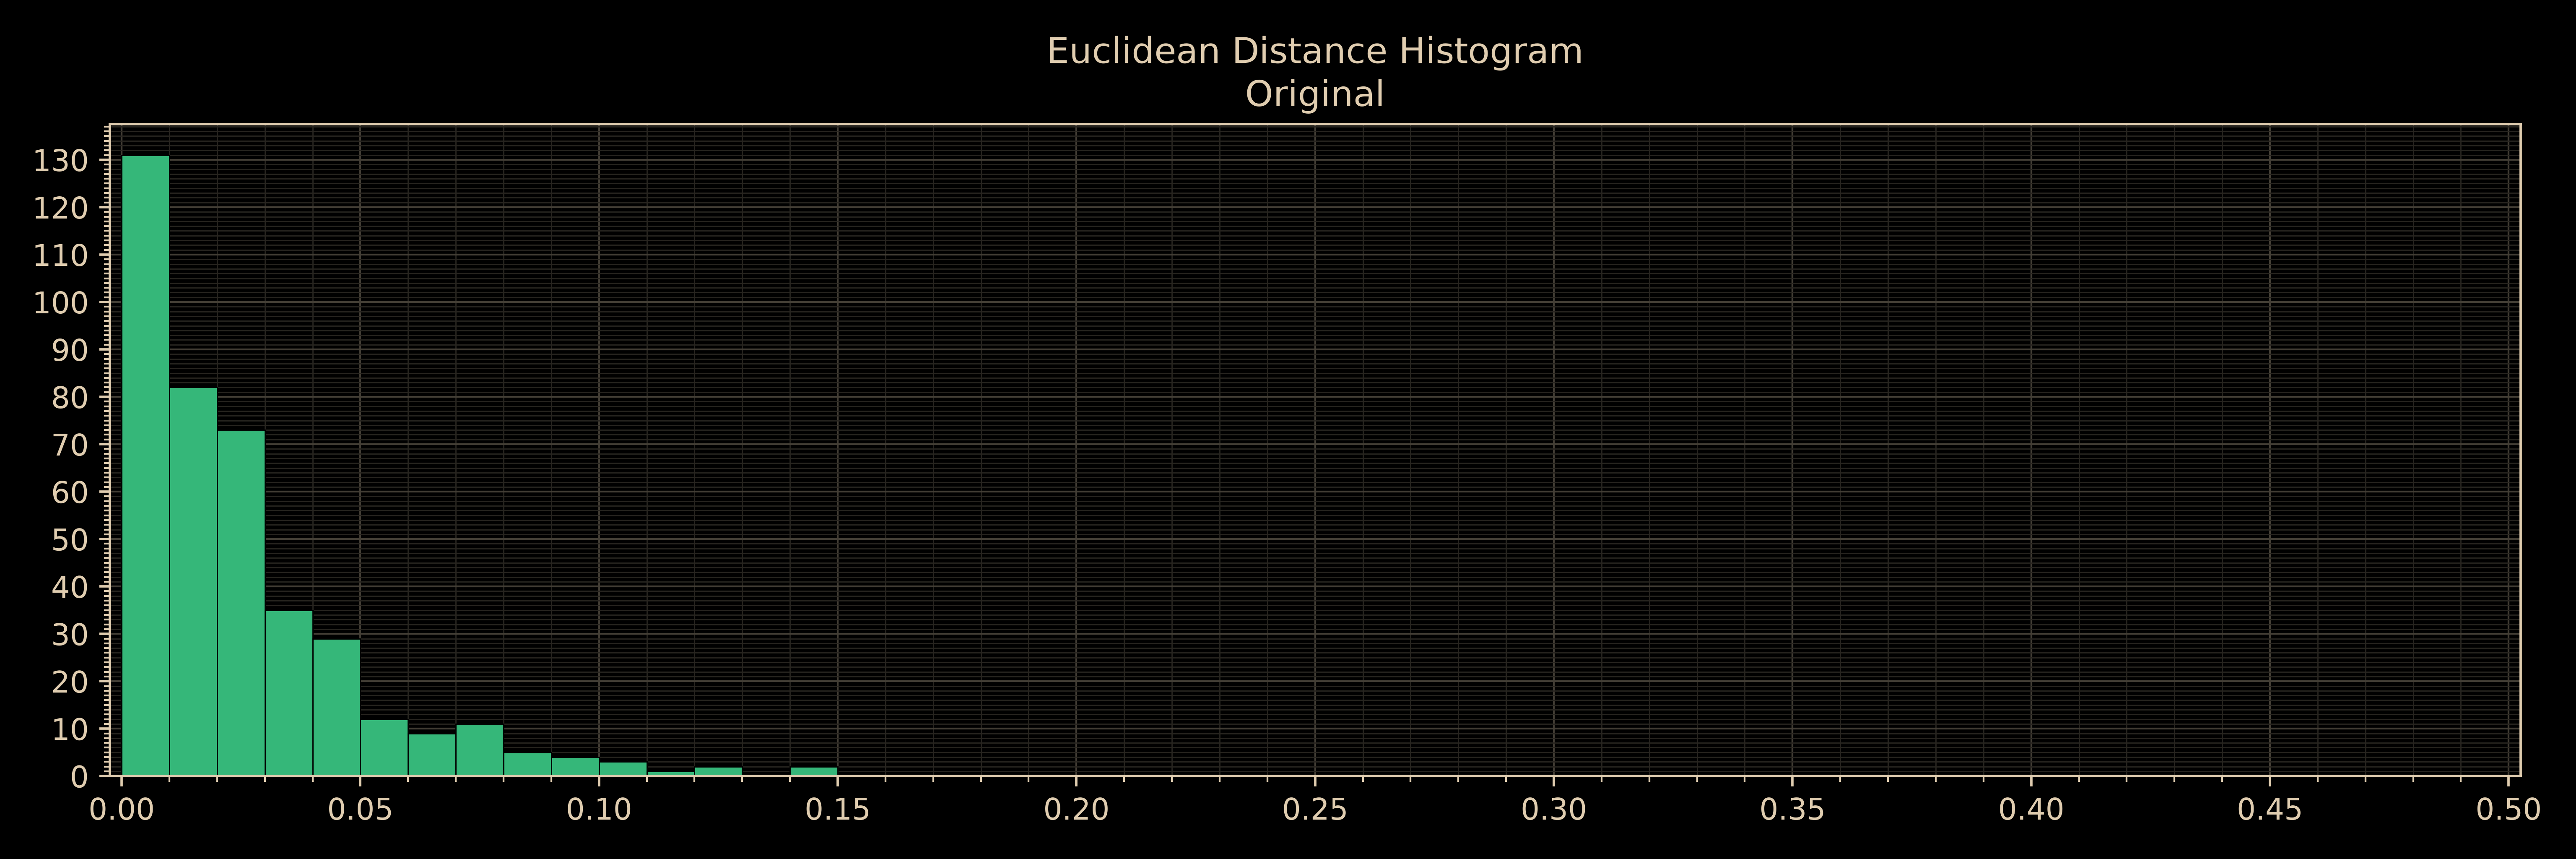
This is a histogram of the Euclidean distance between all pairs of consecutive Pareto front members:
The following three images show this Pareto front downselected from 400 points to 100 points using three methods:
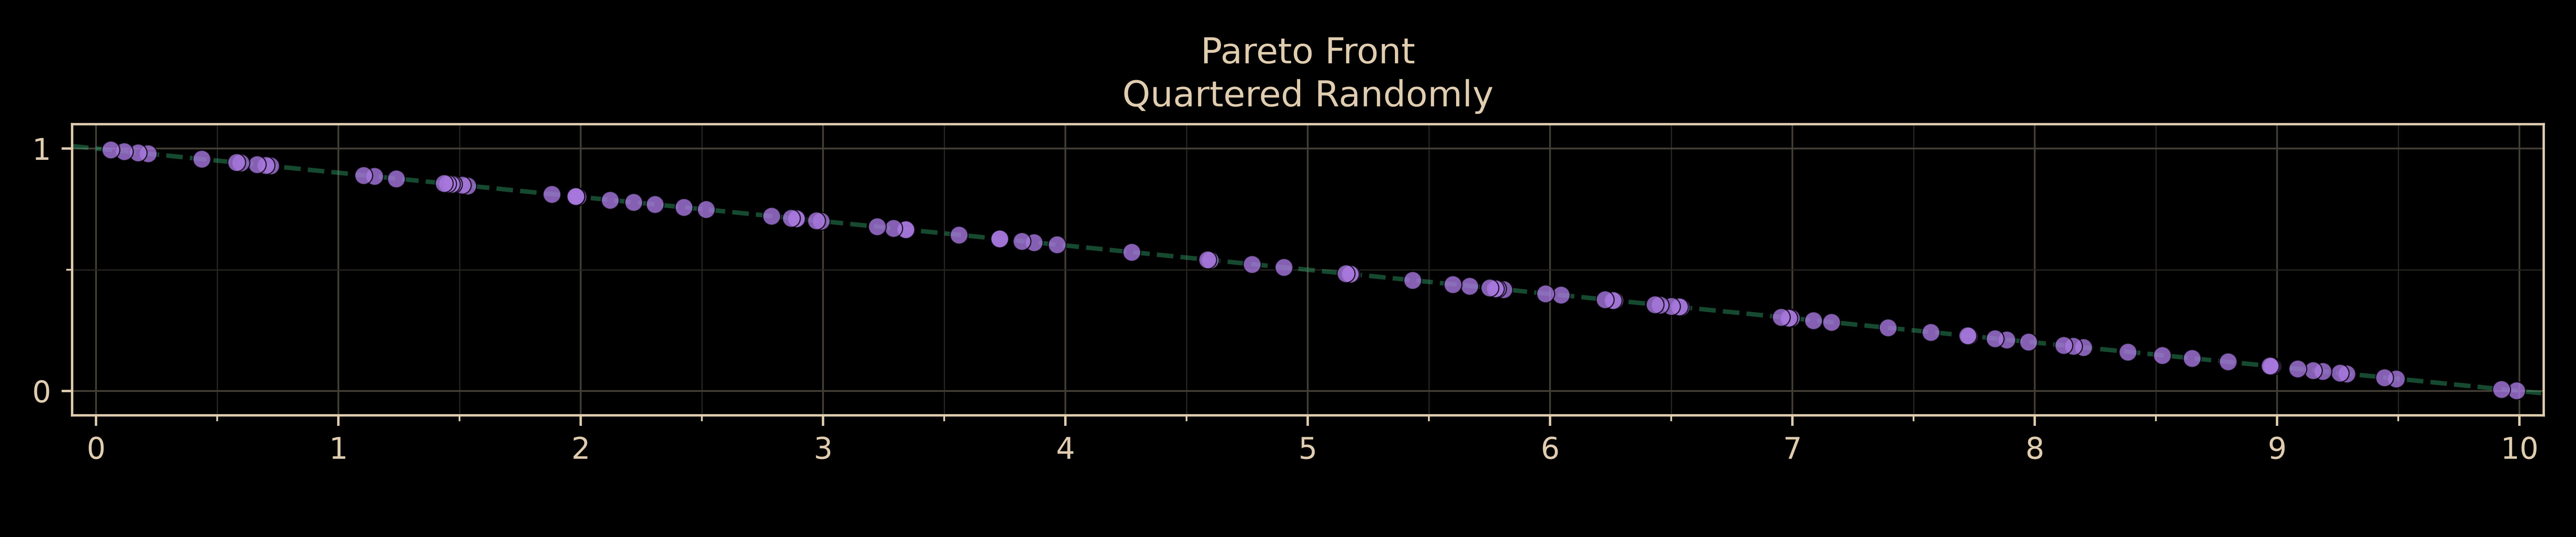
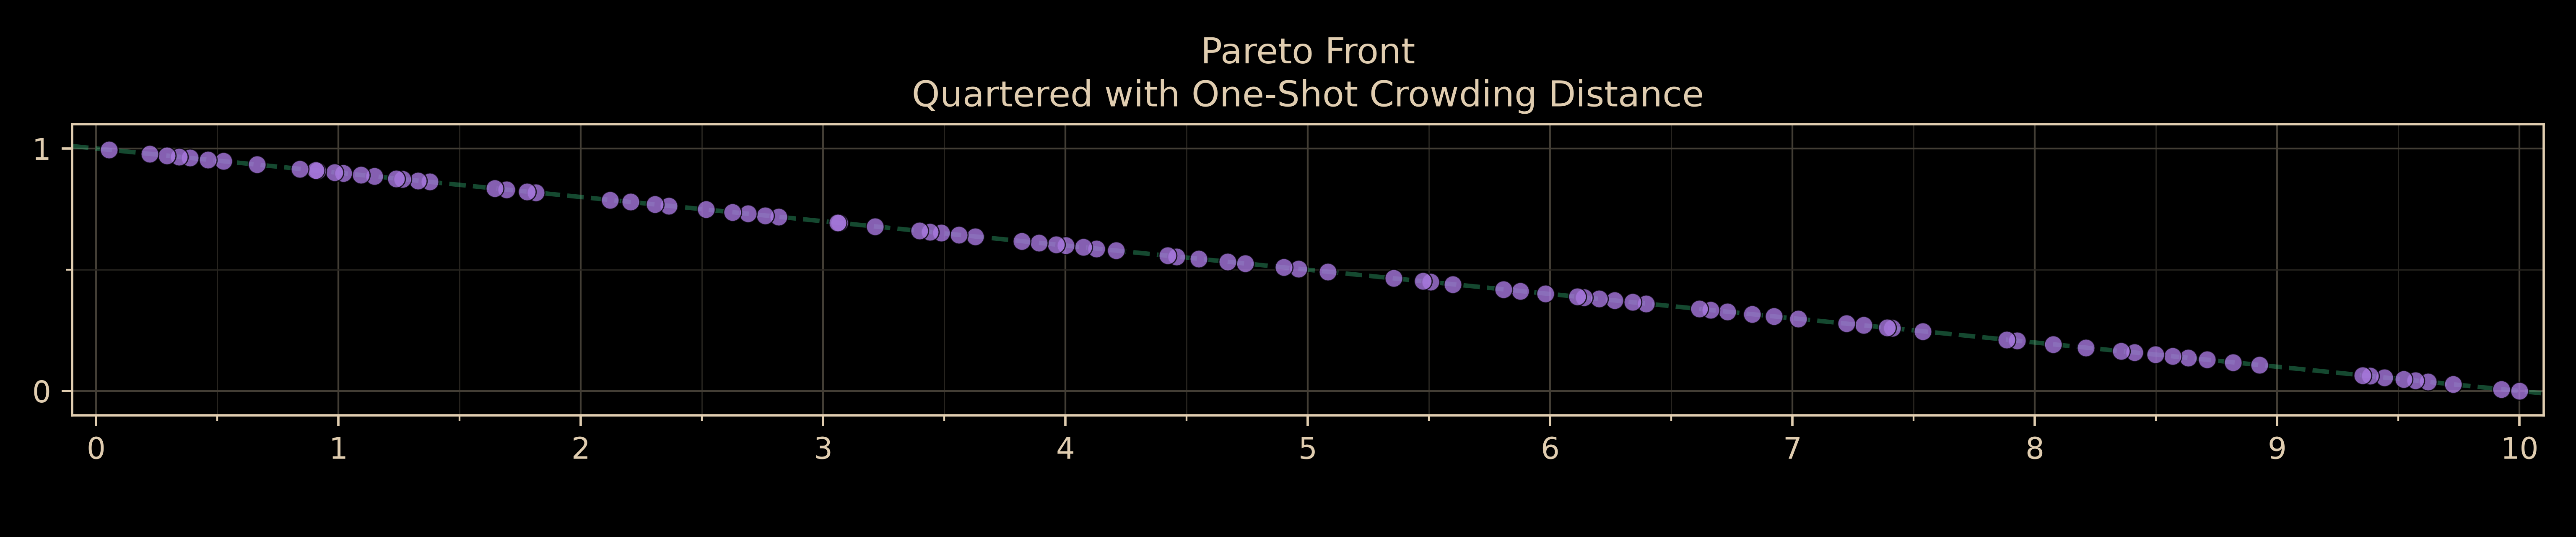
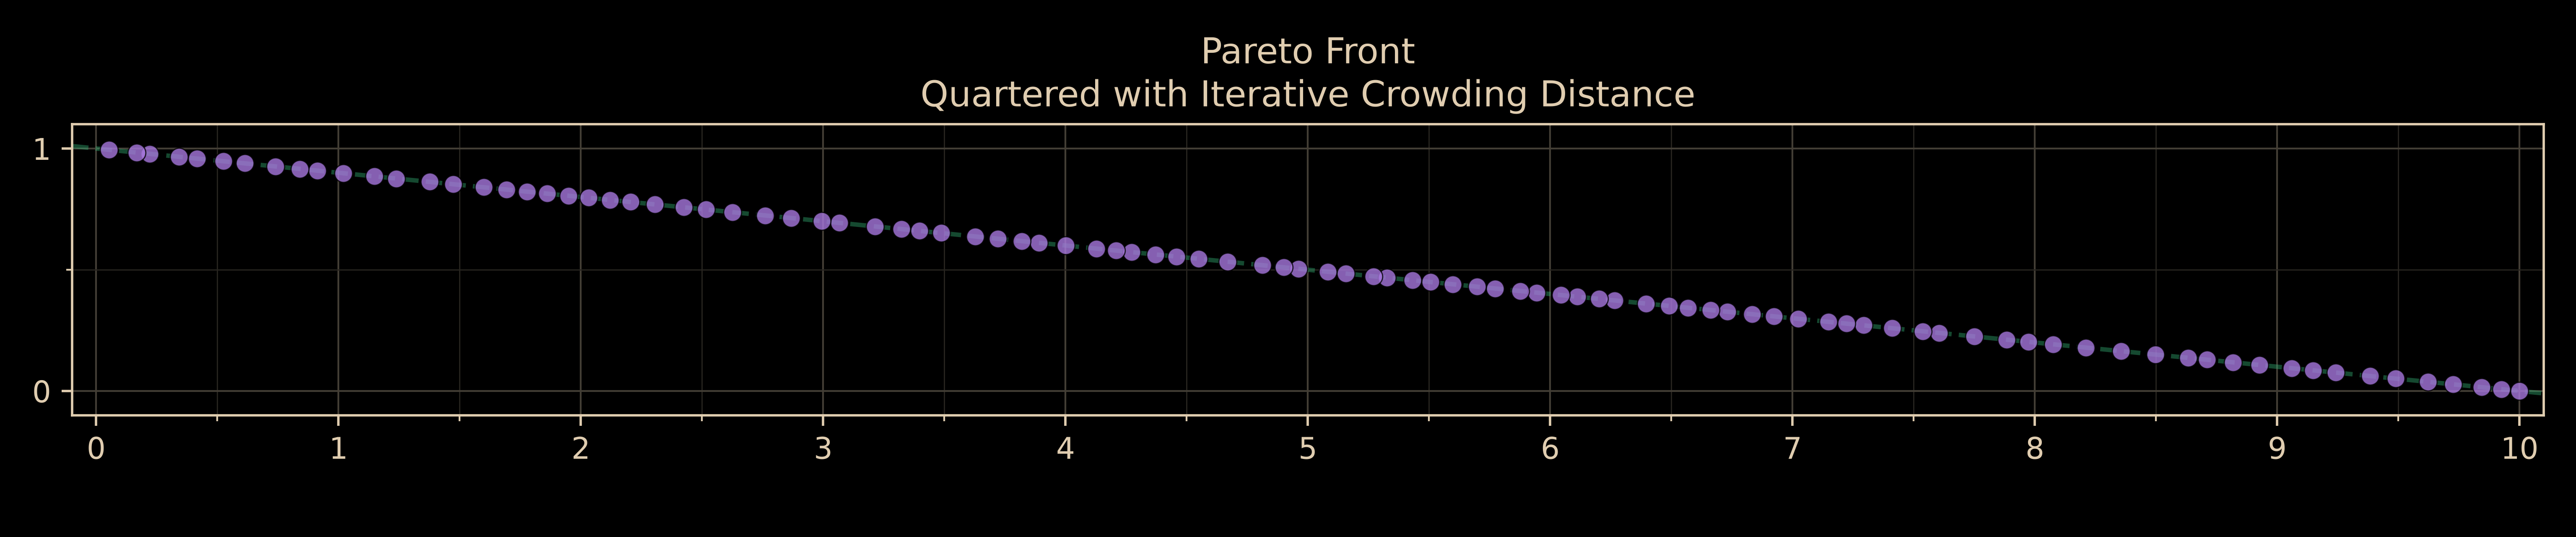
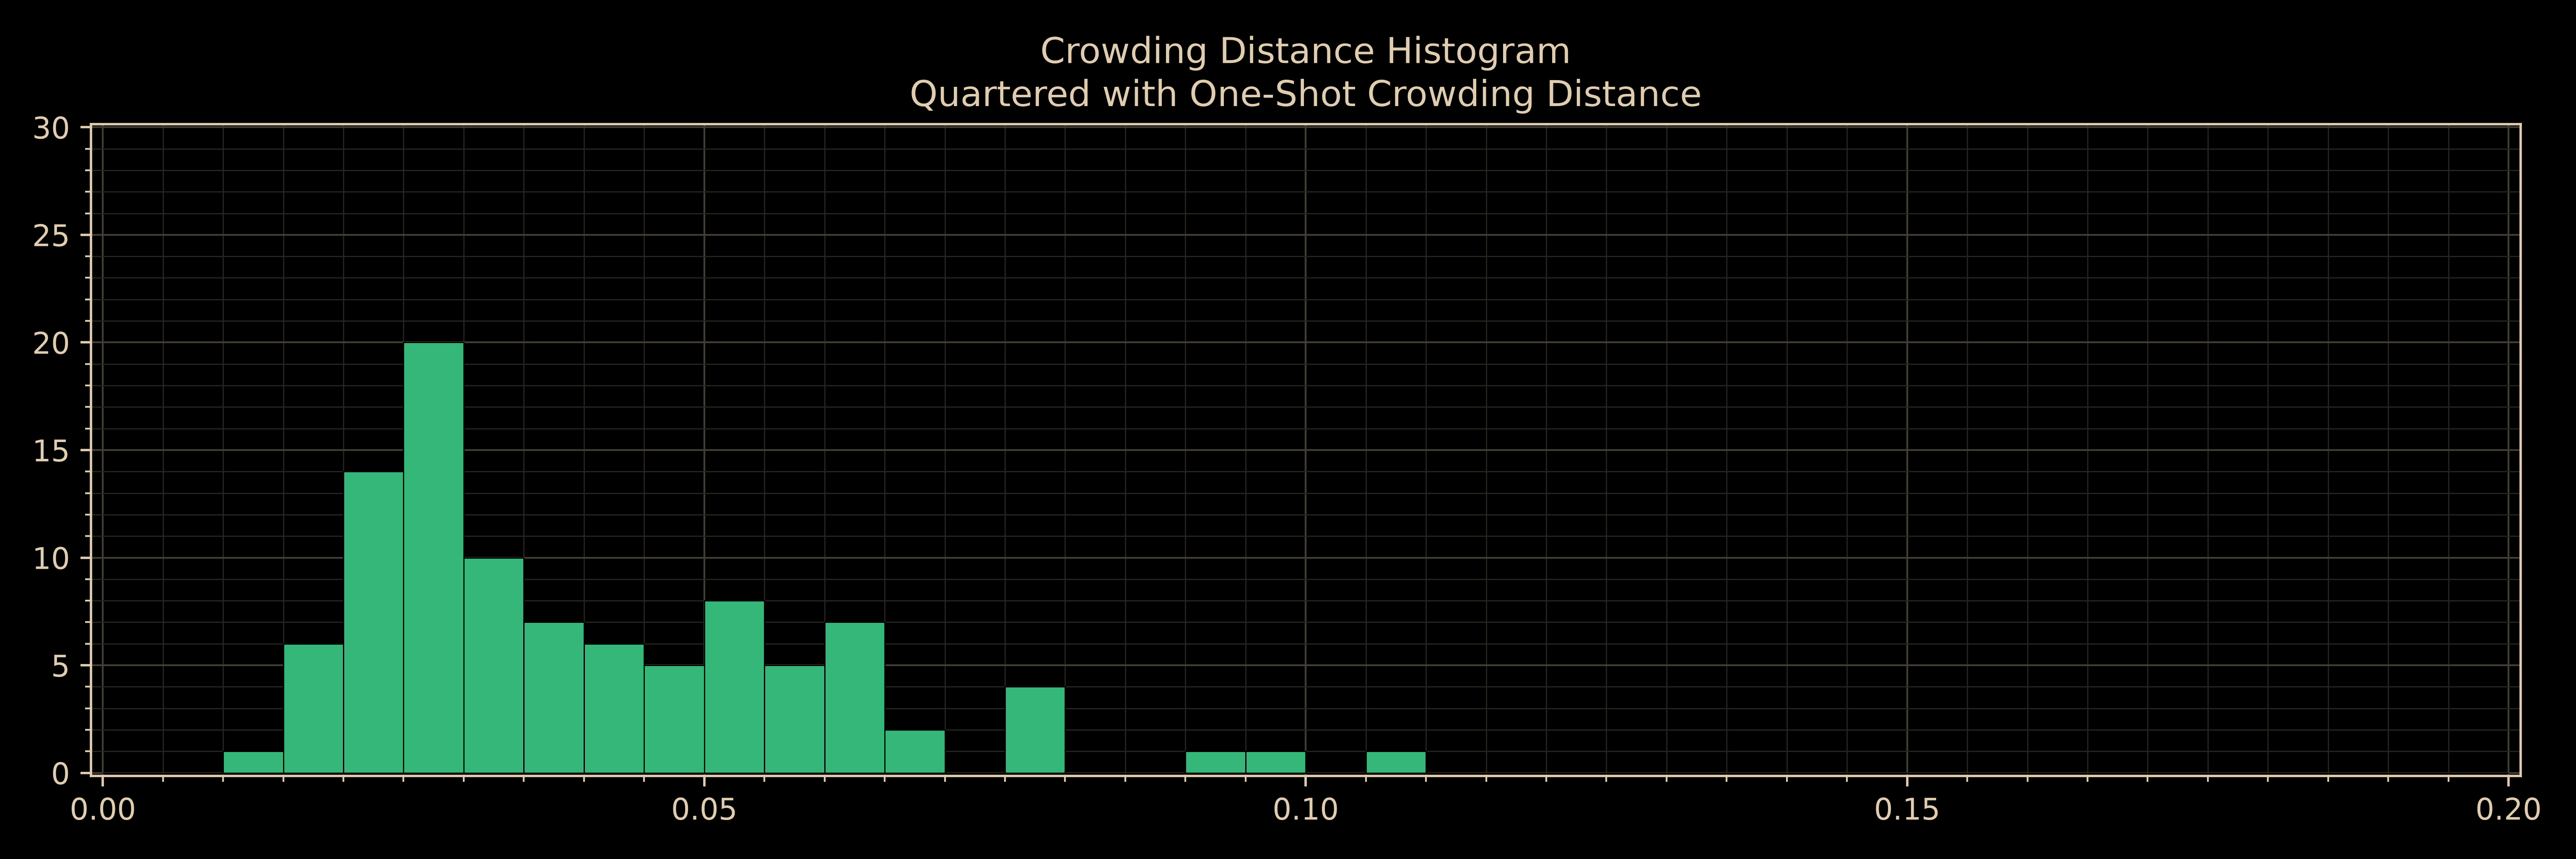
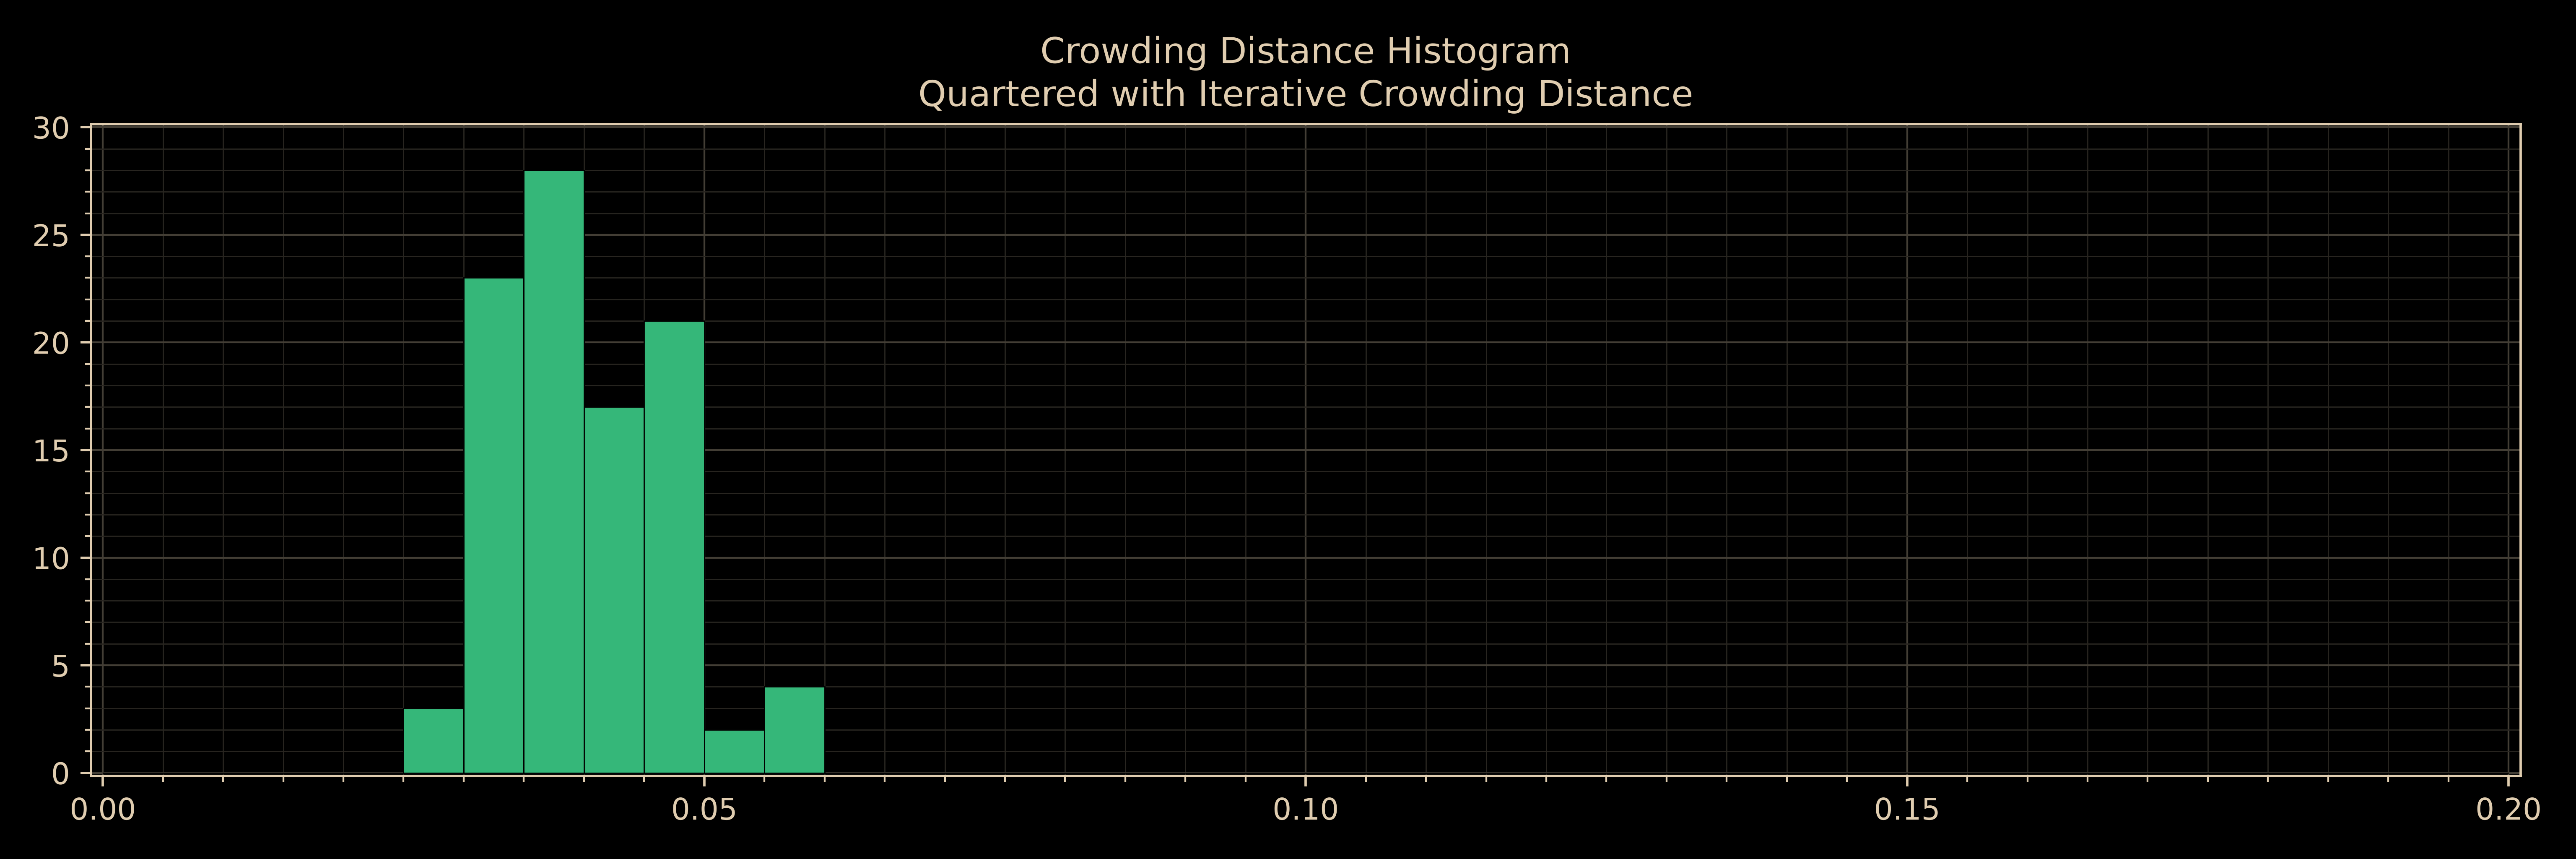
The following three images are histograms of the final crowding distances for each of the downselected Pareto fronts above:
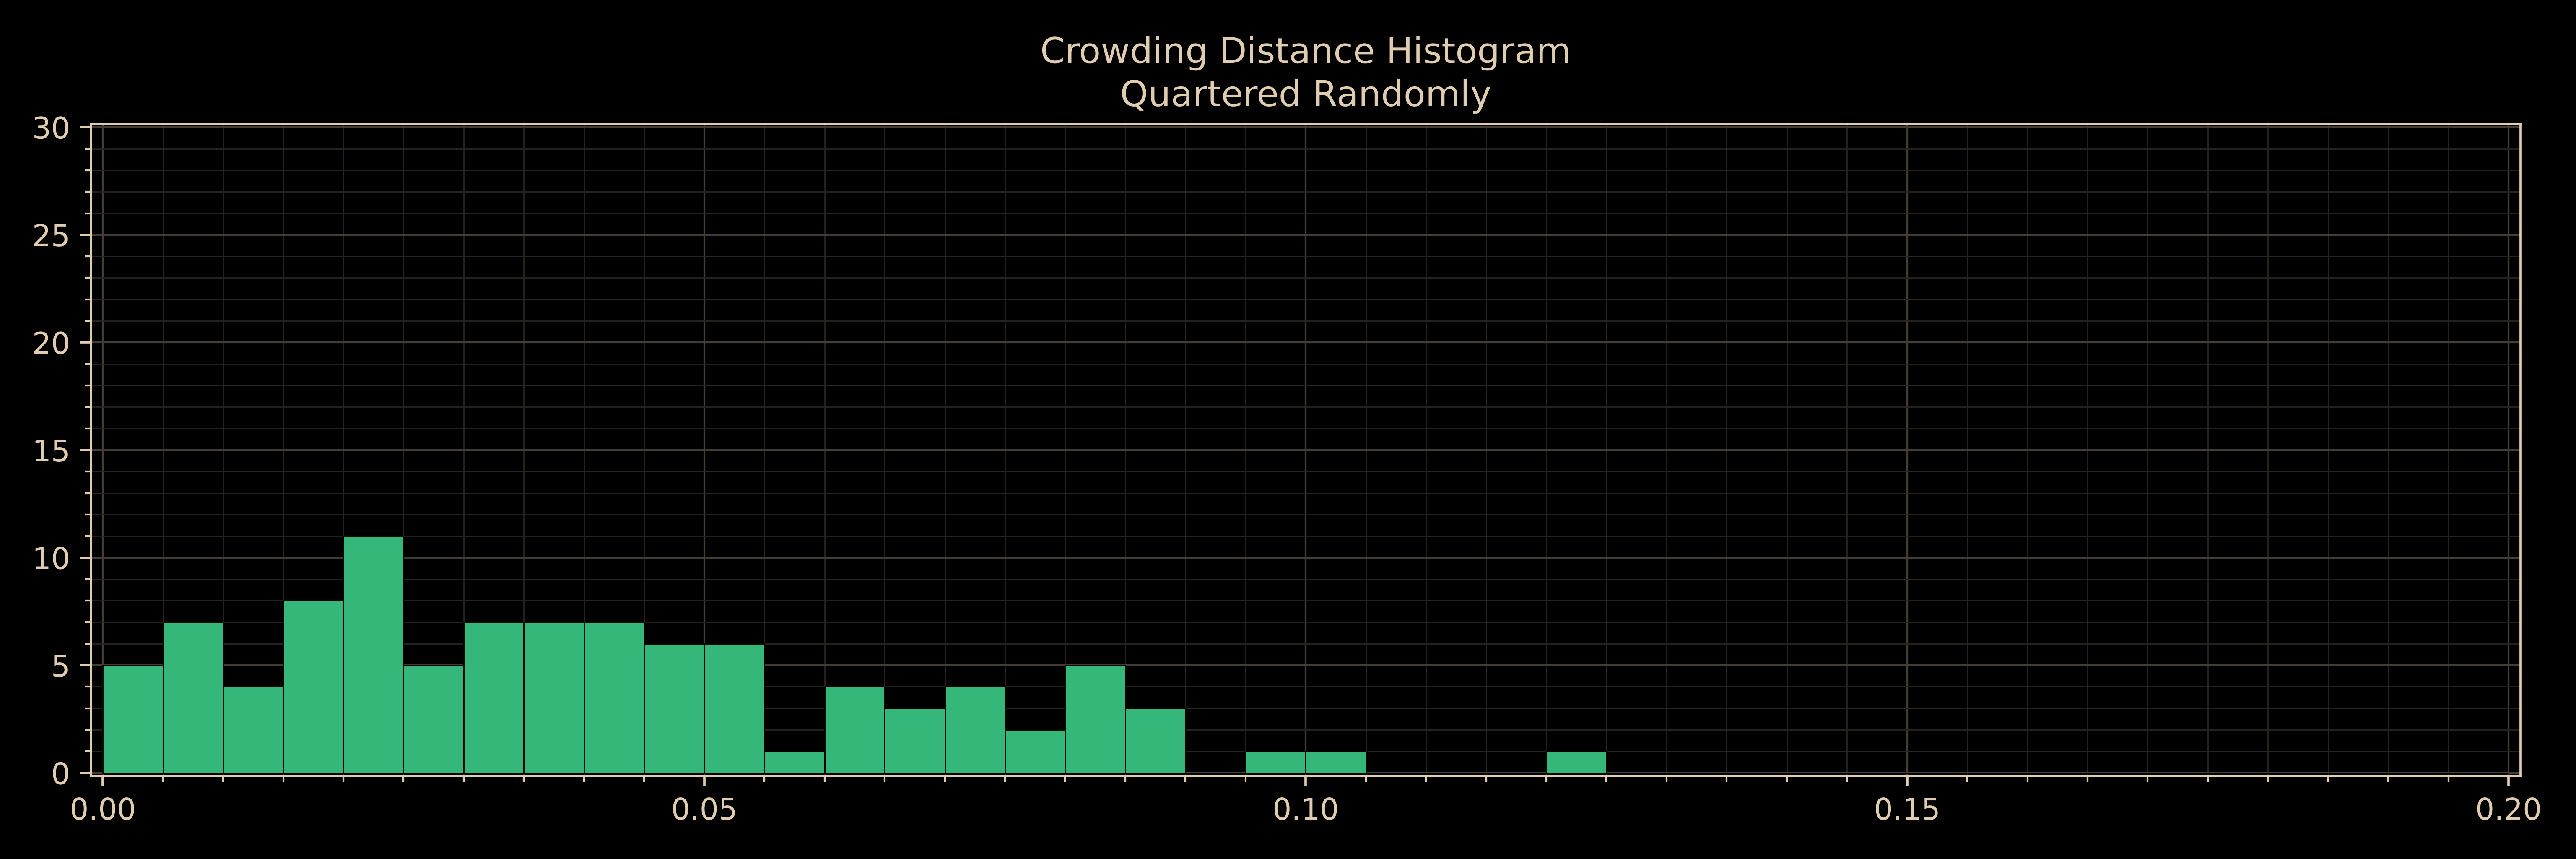
The following three images are histograms of the Euclidean distances between all consecutive pairs of points in the downselected Pareto fronts above:
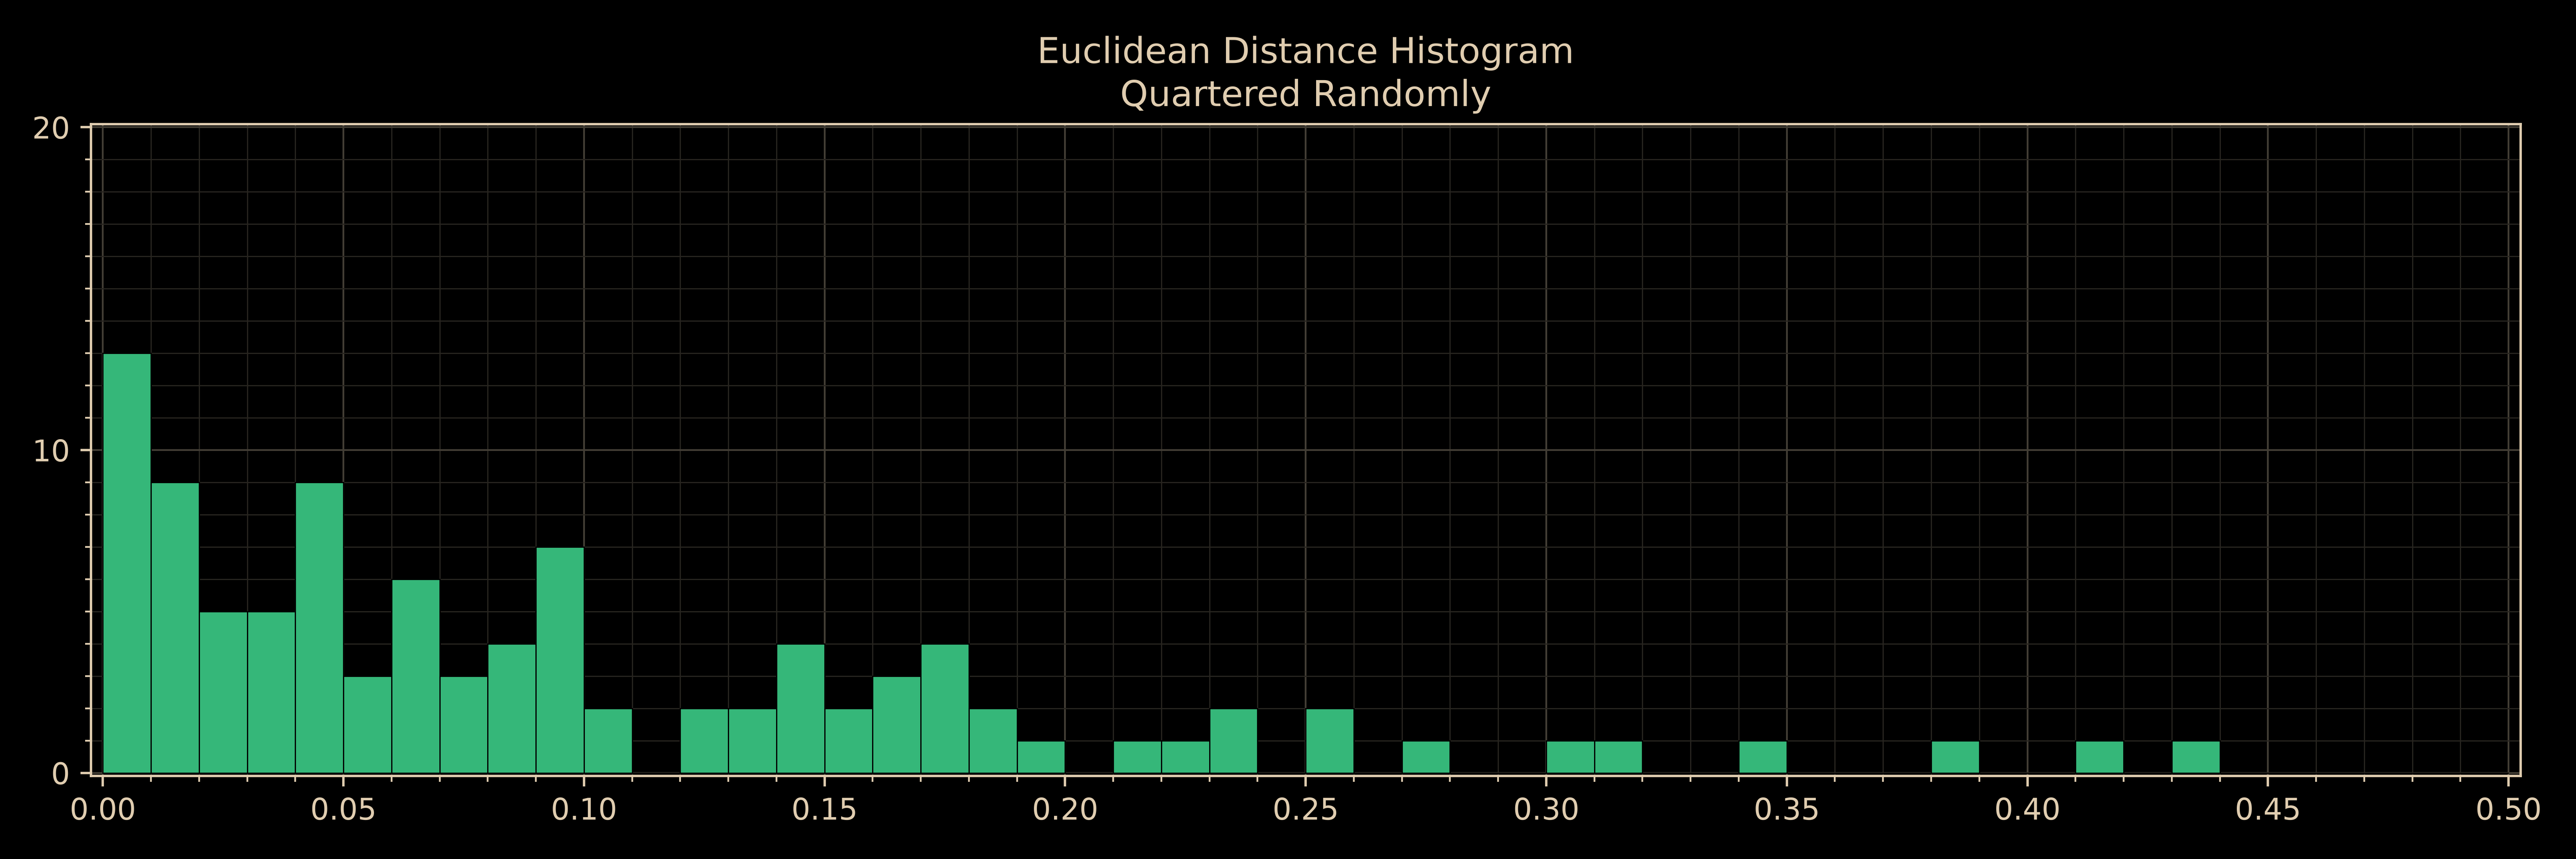
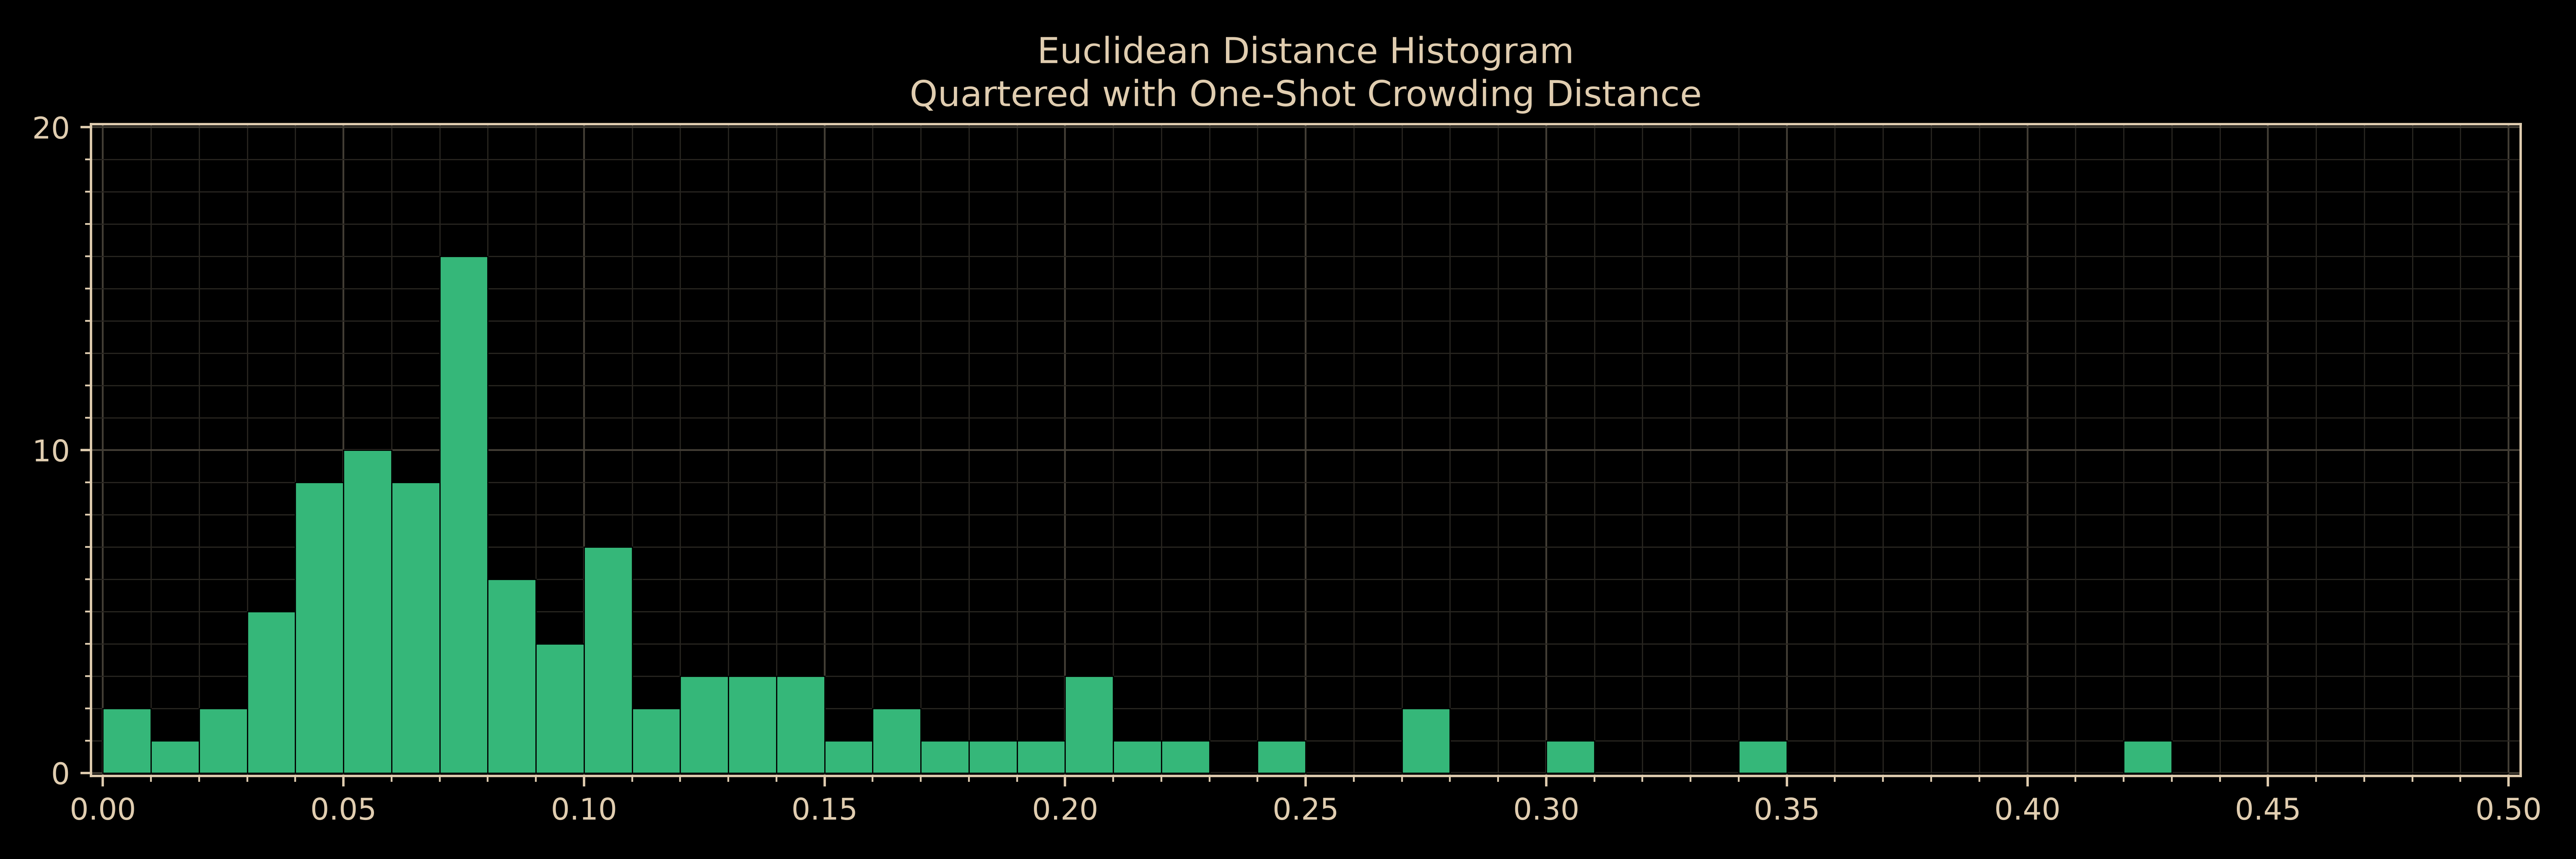
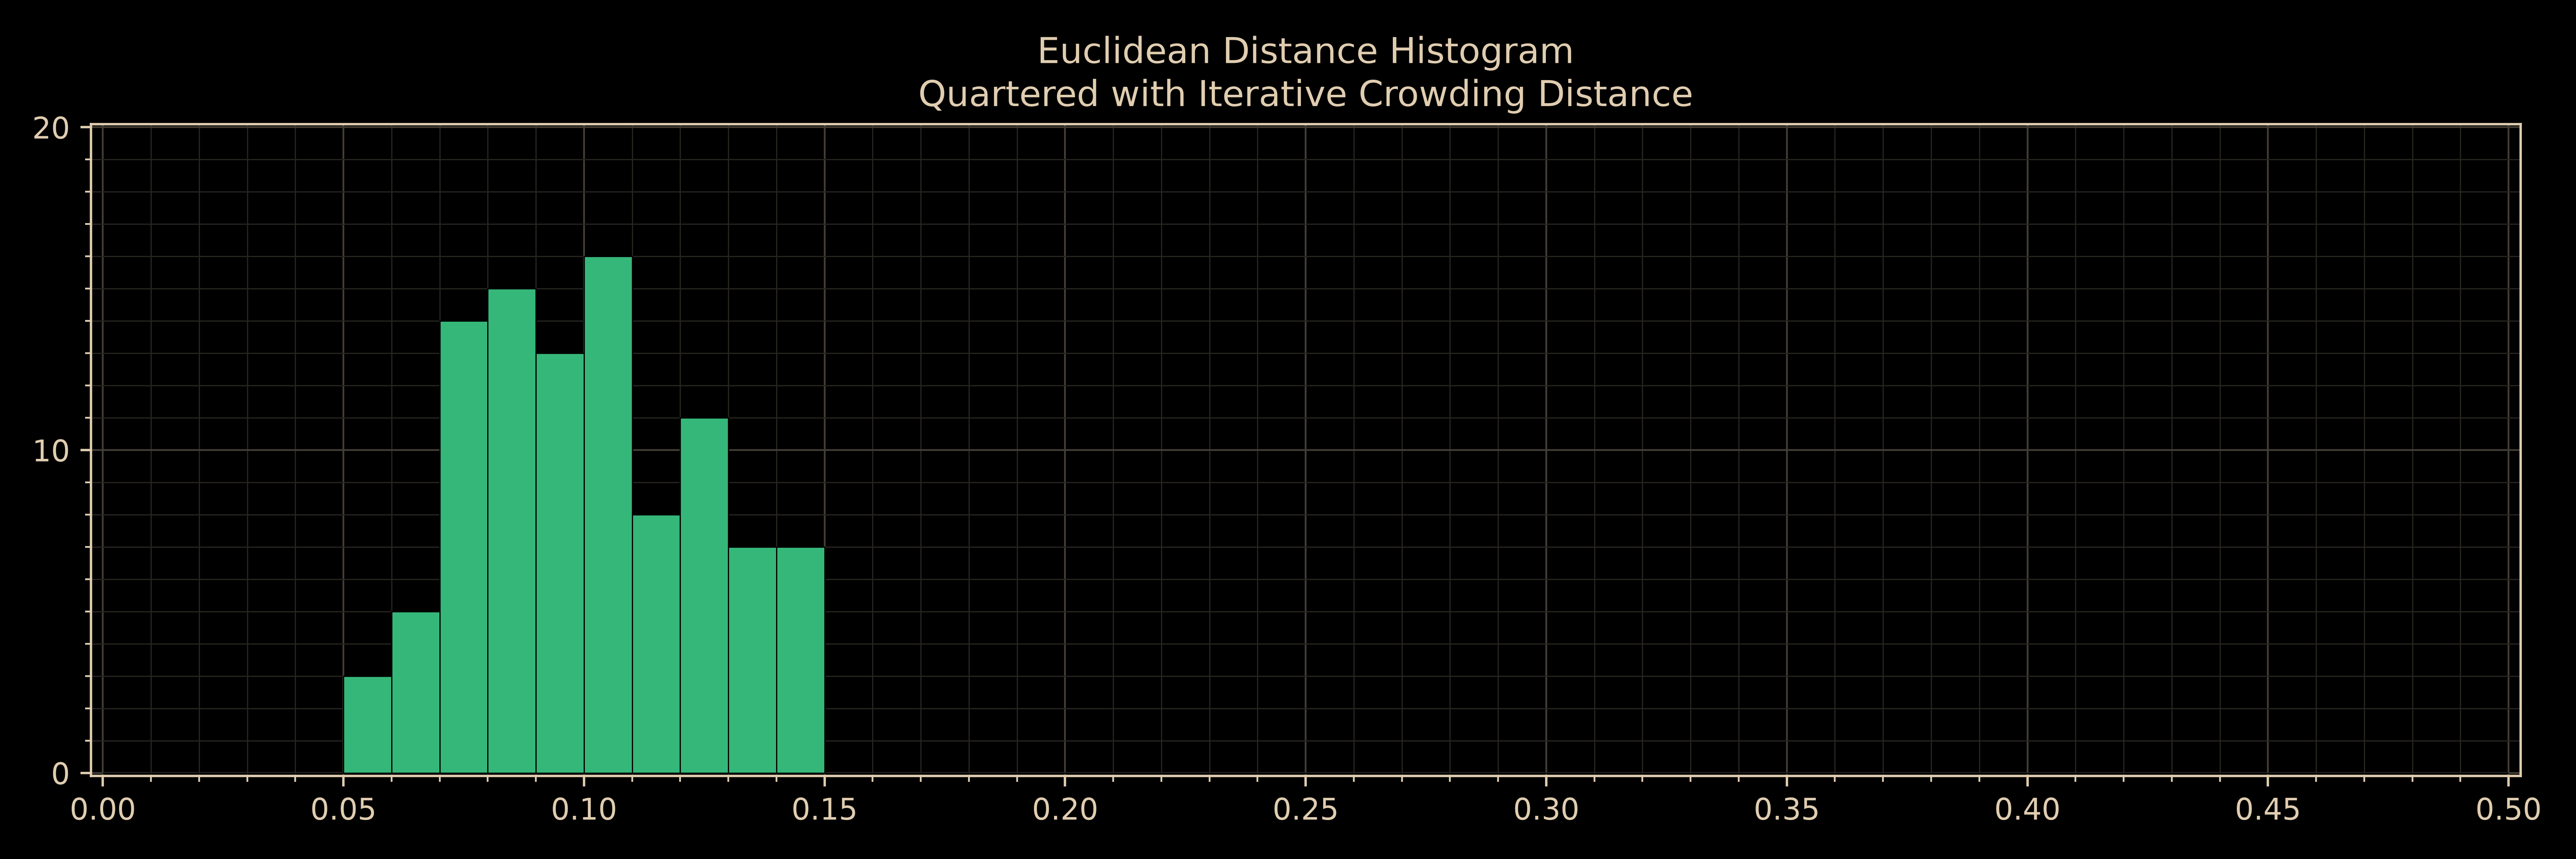
The iterative crowding distance downselection produces a subset that's noticeably more uniform across the Pareto front than the one-shot crowding distance.
Future work:
The example Pareto front image was made in LibreOffice Draw. All other
results and images came from this Python script on Linux using Python 3.13.5 and
random number generator seed 1162639579025111564. Use this code at
your own risk.
#!/usr/bin/env python3

import cycler
import matplotlib.patheffects
import matplotlib.pyplot
import matplotlib.ticker
import matplotlib.typing

import argparse
import collections.abc
import dataclasses
import datetime
import enum
import itertools
import math
import os
import random
import time
import typing


class LineStyle(enum.Enum):
	SOLID  = "-"
	DASHED = "--"


@dataclasses.dataclass(frozen = True, slots = True)
class Line:
	point_a: tuple[float, float]
	point_b: tuple[float, float]
	style:   LineStyle = LineStyle.SOLID
	alpha:   float     = 0.8


@dataclasses.dataclass(frozen = True, slots = True)
class Scatter:
	x:     str
	y:     str
	alpha: float = 0.8


PLOT_THEME: dict[matplotlib.typing.RcKeyType, typing.Any] = {
	"axes.axisbelow":        True,
	"axes.edgecolor":        "#e0cdb0",
	"axes.facecolor":        "#000000",
	"axes.grid":             True,
	"axes.grid.which":       "both",
	"axes.prop_cycle":       cycler.cycler(
		color = ["#35b779", "#a878de", "#398fe5", "#e65c64"],
	),
	"figure.facecolor":      "#000000",
	"grid.major.color":      "#433e35",
	"grid.major.linewidth":  0.6,
	"grid.minor.color":      "#282520",
	"grid.minor.linewidth":  0.4,
	"patch.edgecolor":      "#000000", #"#e0cdb0",
	"patch.force_edgecolor": True,
	"patch.linewidth":       0.4,
	"scatter.edgecolors":    "#000000",
	"text.color":            "#e0cdb0",
	"xtick.color":           "#e0cdb0",
	"ytick.color":           "#e0cdb0",
}


def nth_value[T](it: collections.abc.Iterable[T], n: int) -> T:
	try:
		return next(x for i, x in enumerate(it) if i == n)
	except StopIteration:
		if n == 1:
			raise IndexError("no 1st value")
		elif n == 2:
			raise IndexError("no 2nd value")
		elif n == 3:
			raise IndexError("no 3rd value")
		else:
			raise IndexError(f"no {n}th value")


def make_new_datetime_directory(*, prefix: str = "", suffix: str = "") -> str:
	while True:
		timestamp: str = (
			datetime
			.datetime
			.now()
			.isoformat(sep = "_", timespec = "seconds")
			.replace(":", "-")
		)
		new_directory_path: str = f"{prefix}{timestamp}{suffix}/"
		if os.path.isdir(new_directory_path):
			time.sleep(1.0)
			continue
		os.makedirs(new_directory_path)
		break
	return new_directory_path


def save_plot(
	*,
	data:        list[dict[str, float]],
	subjects:    list[Line | Scatter],
	x_limits:    tuple[float, float],
	y_limits:    tuple[float, float],
	figure_size: tuple[float, float],
	title:       str,
	file_path:   str,
) -> None:
	with matplotlib.pyplot.rc_context(PLOT_THEME):
		figure = matplotlib.pyplot.figure(
			figsize = figure_size,
			dpi     = 512,
			layout  = "tight",
		)
		axes = figure.add_subplot(1, 1, 1)
		axes.xaxis.set_major_locator(matplotlib.ticker.MultipleLocator(1))
		axes.xaxis.set_minor_locator(matplotlib.ticker.MultipleLocator(0.5))
		axes.yaxis.set_major_locator(matplotlib.ticker.MultipleLocator(1))
		axes.yaxis.set_minor_locator(matplotlib.ticker.MultipleLocator(0.5))
		axes.set_aspect("equal")
		axes.set_title(title)
		axes.set_xlim(x_limits)
		axes.set_ylim(y_limits)
		for index, subject, style in zip(
			range(len(subjects)),
			subjects,
			PLOT_THEME["axes.prop_cycle"],
		):
			if isinstance(subject, Line):
				axes.axline(
					xy1       = subject.point_a,
					xy2       = subject.point_b,
					linestyle = subject.style.value,
					alpha     = subject.alpha,
					zorder    = index + 1,
					**style,
				)
			elif isinstance(subject, Scatter):
				axes.scatter(
					x         = [row[subject.x] for row in data],
					y         = [row[subject.y] for row in data],
					alpha     = subject.alpha,
					edgecolor = PLOT_THEME["scatter.edgecolors"],
					linewidth = PLOT_THEME["grid.minor.linewidth"],
					zorder    = index + 1,
					**style,
				)
			else:
				raise TypeError("not a valid plot subject")
		figure.savefig(file_path)
		matplotlib.pyplot.close(figure)


def save_histogram(
	*,
	values:        list[float],
	bins:          list[float],
	max_count:     int | None,
	major_x_ticks: float,
	major_y_ticks: int,
	figure_size:   tuple[float, float],
	title:         str,
	file_path:     str,
) -> None:
	x_padding: float = (bins[-1] - bins[0]) * 0.005
	bad_lower_bound: bool = any(v < bins[ 0] for v in values)
	bad_upper_bound: bool = any(v > bins[-1] for v in values)
	bad_color: str = nth_value(PLOT_THEME["axes.prop_cycle"], 1)["color"]
	with matplotlib.pyplot.rc_context(PLOT_THEME):
		figure = matplotlib.pyplot.figure(
			figsize = figure_size,
			dpi     = 512,
			layout  = "tight",
		)
		axes = figure.add_subplot(1, 1, 1)
		axes.xaxis.set_major_locator(matplotlib.ticker.MultipleLocator(major_x_ticks))
		axes.xaxis.set_minor_locator(matplotlib.ticker.FixedLocator(bins))
		axes.yaxis.set_major_locator(matplotlib.ticker.MultipleLocator(major_y_ticks))
		axes.yaxis.set_minor_locator(matplotlib.ticker.MultipleLocator(1))
		axes.set_title(title)
		axes.set_xlim((bins[0] - x_padding, bins[-1] + x_padding))
		if max_count is not None:
			y_padding: float = max_count * 0.005
			axes.set_ylim((-y_padding, max_count + y_padding))
		axes.hist(
			x    = values,
			bins = bins,
		)
		if bad_lower_bound:
			axes.annotate(
				text                = "More data not shown",
				xy                  = (0.01, 0.5),
				xytext              = (0.04, 0.5),
				xycoords            = "axes fraction",
				horizontalalignment = "left",
				verticalalignment   = "center",
				fontweight          = "bold",
				color               = bad_color,
				alpha               = 0.8,
				path_effects = [
					matplotlib.patheffects.withStroke(
						linewidth  = PLOT_THEME["grid.major.linewidth"],
						foreground = PLOT_THEME["scatter.edgecolors"],
					),
				],
				arrowprops = {
					"width":      5.0,
					"headwidth":  12.0,
					"headlength": 12.0,
					"facecolor":  bad_color,
					"edgecolor":  PLOT_THEME["scatter.edgecolors"],
				},
			)
		if bad_upper_bound:
			axes.annotate(
				text                = "More data not shown",
				xy                  = (0.99 , 0.5),
				xytext              = (0.96, 0.5),
				xycoords            = "axes fraction",
				horizontalalignment = "right",
				verticalalignment   = "center",
				fontweight          = "bold",
				color               = bad_color,
				alpha               = 0.8,
				path_effects = [
					matplotlib.patheffects.withStroke(
						linewidth  = PLOT_THEME["grid.major.linewidth"],
						foreground = PLOT_THEME["scatter.edgecolors"],
					),
				],
				arrowprops = {
					"width":      5.0,
					"headwidth":  12.0,
					"headlength": 12.0,
					"facecolor":  bad_color,
					"edgecolor":  PLOT_THEME["scatter.edgecolors"],
				},
			)
		figure.savefig(file_path)
		matplotlib.pyplot.close(figure)


def calculate_euclidean_distances(rows: list[dict[str, float]]) -> list[float]:
	rows.sort(key = lambda row: row["x"])
	return [
		math.sqrt((a["x"] - b["x"]) ** 2 + (a["y"] - b["y"]) ** 2)
		for a, b in itertools.pairwise(rows)
	]


def add_crowding_distance(
	rows:      list[dict[str, float]],
	key:       str,
) -> None:
	if len(rows) <= 2:
		for row in rows:
			row[key] = math.inf
		return
	for row in rows:
		row[key] = 0.0
	for dim in ["x", "y"]:
		rows.sort(key = lambda row: row[dim])
		span: float = rows[-1][dim] - rows[0][dim]
		if span == 0.0:
			continue
		rows[ 0][key] = math.inf
		rows[-1][key] = math.inf
		for i in range(1, len(rows) - 1):
			rows[i][key] += (
				(rows[i + 1][dim] - rows[i - 1][dim])
				/ span
			)


def plot(
	*,
	data:                  list[dict[str, float]],
	limit_histograms:      bool,
	number:                int,
	crowding_distance_key: str,
	title:                 str,
	output_directory_path: str,
) -> None:
	if len(output_directory_path) == 0:
		raise ValueError("plot output directory path must not be empty")
	suffix: str = f"{number}-{crowding_distance_key}"
	crowding_distances: list[float] = [
		row[crowding_distance_key]
		for row in data
		if math.isfinite(row[crowding_distance_key])
	]
	save_plot(
		data = data,
		subjects = [
			Line(
				point_a = (0.0, 1.0),
				point_b = (10.0, 0.0),
				style   = LineStyle.DASHED,
				alpha   = 0.4,
			),
			Scatter("x", "y"),
		],
		x_limits    = (-0.1, 10.1),
		y_limits    = (-0.1,  1.1),
		figure_size = (12.0, 2.5),
		title       = f"Pareto Front\n{title}",
		file_path   = f"{output_directory_path}/front-{suffix}.png",
	)
	save_histogram(
		values        = calculate_euclidean_distances(data),
		bins          = [i / 100.0 for i in range(51)],
		max_count     = 20 if limit_histograms else None,
		major_x_ticks = 0.05,
		major_y_ticks = 10,
		figure_size   = (12.0, 4.0),
		title         = f"Euclidean Distance Histogram\n{title}",
		file_path     = f"{output_directory_path}/euclidean-{suffix}.png",
	)
	save_histogram(
		values        = crowding_distances,
		bins          = [i / 200.0 for i in range(41)],
		max_count     = 30 if limit_histograms else None,
		major_x_ticks = 0.05,
		major_y_ticks = 5,
		figure_size   = (12.0, 4.0),
		title         = f"Crowding Distance Histogram\n{title}",
		file_path     = f"{output_directory_path}/crowding-{suffix}.png",
	)


def main(
	*,
	rng_seed:              int | None,
	begin_size:            int,
	end_size:              int,
	output_directory_path: str | None,
) -> None:
	if rng_seed is None:
		rng_seed = int.from_bytes(os.getrandom(8), signed = False)
	rng = random.Random(rng_seed)
	print(f"seed {rng_seed}", flush = True)

	if output_directory_path is None:
		output_directory_path = make_new_datetime_directory(
			suffix = f"_{rng_seed}"
		)
	elif len(output_directory_path) == 0:
		raise ValueError("output directory path must not be empty")
	else:
		os.makedirs(output_directory_path, exist_ok = True)
	print(f"output \"{output_directory_path}\"")

	data: list[dict[str, float]] = []
	for _ in range(begin_size):
		x: float = rng.uniform(0.0, 10.0)
		y: float = -0.1 * x + 1.0
		data.append({"x": x, "y": y})

	add_crowding_distance(data, "2cd")
	plot(
		data                  = data,
		limit_histograms      = False,
		number                = 0,
		crowding_distance_key = "2cd",
		title                 = "Original",
		output_directory_path = output_directory_path,
	)

	rng.shuffle(data)
	subset_a: list[dict[str, float]] = data[:end_size]
	add_crowding_distance(subset_a, "2cd")
	plot(
		data                  = subset_a,
		limit_histograms      = True,
		number                = 1,
		crowding_distance_key = "2cd",
		title                 = "Quartered Randomly",
		output_directory_path = output_directory_path,
	)

	add_crowding_distance(data, "2cd")
	data.sort(key = lambda row: row["2cd"], reverse = True)
	subset_b: list[dict[str, float]] = data[:end_size]
	add_crowding_distance(subset_b, "2cd")
	plot(
		data                  = subset_b,
		limit_histograms      = True,
		number                = 2,
		crowding_distance_key = "2cd",
		title                 = "Quartered with One-Shot Crowding Distance",
		output_directory_path = output_directory_path,
	)

	add_crowding_distance(data, "2cd")
	while len(data) > end_size:
		i: int = min(range(len(data)), key = lambda i: data[i]["2cd"])
		data.pop(i)
		add_crowding_distance(data, "2cd")
	plot(
		data                  = data,
		limit_histograms      = True,
		number                = 3,
		crowding_distance_key = "2cd",
		title                 = "Quartered with Iterative Crowding Distance",
		output_directory_path = output_directory_path,
	)


def make_cli() -> argparse.ArgumentParser:
	class FixedWidthFormatter(argparse.ArgumentDefaultsHelpFormatter):
		def __init__(self, prog: str) -> None:
			super().__init__(prog, width = 80)
	parser = argparse.ArgumentParser(formatter_class = FixedWidthFormatter)
	parser.add_argument(
		"-b",
		"--begin-size",
		metavar = "<int>",
		dest    = "begin_size",
		type    = int,
		default = 400,
		help    = (
			"Initial Pareto front size. Must be nonnegative and greater than "
			"or equal to --end-size."
		),
	)
	parser.add_argument(
		"-e",
		"--end-size",
		metavar = "<int>",
		dest    = "end_size",
		type    = int,
		default = 100,
		help    = (
			"Final Pareto front size after downselecting from --begin-size. "
			"Must be nonnegative and less than or equal to --begin-size."
		),
	)
	parser.add_argument(
		"-o",
		"--output-directory",
		metavar = "<directory>",
		dest    = "output_directory_path",
		help    = (
			"Directory in which to save plots. Must not be the empty string. "
			"Will be created if needed. Defaults to a new directory in the "
			"current working directory with a name in the format "
			"YYYY-MM-DD_HH-MM-SS_RRRRRR... (year, month, day, hour, minute, "
			"second, random number seed)."
		)
	)
	parser.add_argument(
		"-r",
		"--rng-seed",
		metavar = "<int>",
		dest    = "rng_seed",
		type    = int,
		help    = (
			"Random Number Generator (RNG) seed as an integer. Defaults to a "
			"random seed taken from system random sources."
		),
	)
	return parser


if __name__ == "__main__":
	args: dict[str, typing.Any] = vars(make_cli().parse_args())
	main(**args)